En esta entrada examinaremos un reclamo de un administrador de portafolio (llamémoslo agente B) a cerca de su habilidad para generar un alfa estadísticamente significativo. El agente B accede a compartir el historial captado de su retorno neto mensual entre mayo de 2003 y septiembre de 2010 para que lo analicemos.
Primero veremos las propiedades estadísticas generales de las series de tiempo, distribución de probabilidad, Gráfica QQ y haremos varias pruebas estadísticas para responder algunas preguntas clave.
Luego calcularemos el exceso de retorno de las series de tiempo. Para retornos libres de riesgo, usaremos la letra de tesoro (o T-Bill) de 4 semanas como proxy, y haremos de nuevo el mismo análisis que hicimos antes con retornos brutos.
Luego analizaremos más de cerca la evidencia de cualquier valor atípico que pueda estar sesgando nuestro análisis, lo cual nos ayudará a identificar un valor atípico potencial en Abril de 2009. Para evaluar el impacto del valor atípico en nuestro análisis, reemplazamos su valor con un valor conectado y notamos el cambio en diferentes estadísticas.
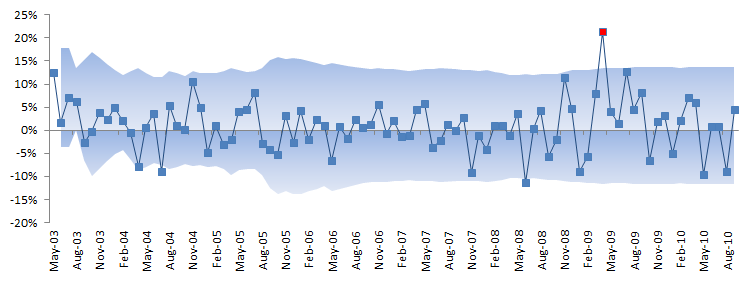
Finalmente, establecimos una banda simple para identificar potenciales valores atípicos que puedan afectar nuestro análisis y encontramos una observación con un retorno excepcionalmente alto.
En suma, la observación de un único valor atípico hecho por alguien genera resultados favorables y la serie de tiempo de retorno no se ve impresionante sin ellos (por decir lo menos). La pregunta que debemos formular es ¿qué tanto será posible que se repita la observación del valor atípico en un futuro?
Análisis
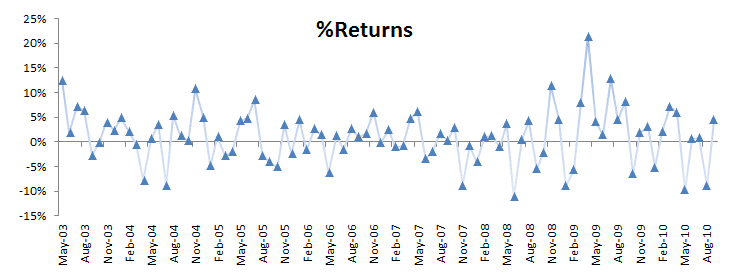
Para los datos de muestra, estamos usando un administrador activo del portafolio de los retornos mensuales entre mayo de 2003 y septiembre de 2010.
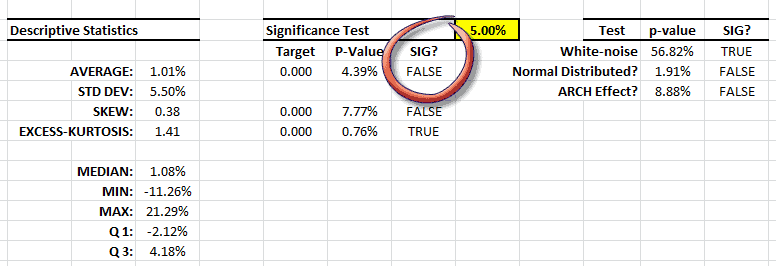
Generemos el resumen de estadísticas de los retornos mensuales brutos:
Los retornos mensuales tienen una media significativa (ej. No cero) y ningún signo de correlación serial o efecto ARCH. La volatilidad de la estrategia (5.48% mensual) es similar a la del index S&P 500 index, así que las series de tiempo a primera vista indican que puede tener un alfa (aka retornos de riesgo gratuito).
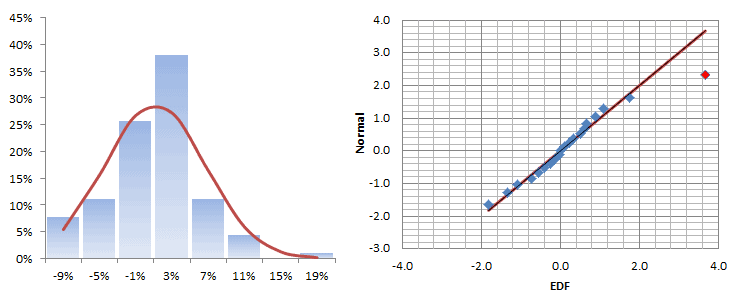
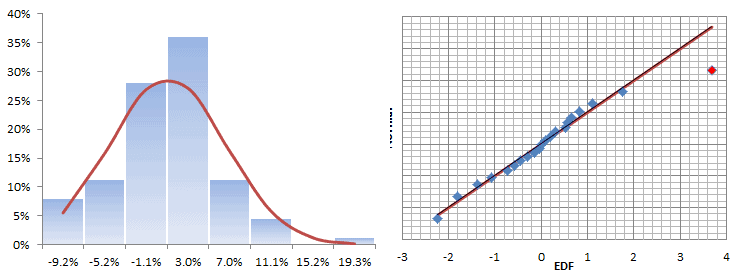
Grafiquemos la distribución y la gráfica QQ de esos retornos:
Los retornos mensuales parecen seguir casi toda la distribución Gaussiana, pero hay un signo de una cola gruesa en el lado derecho. Esto no es necesariamente malo ya que cabe dentro del alza.
Ahora re-direccionemos nuestro foco en el exceso de retornos:
\[ r_a = r – r_{t\to t+d}^f\]
Where
- $r_a$ es el exceso de retorno ajustado
- $r_f$ es el retorno libre de riesgo
- $r$ es el retorno bruto del portafolio
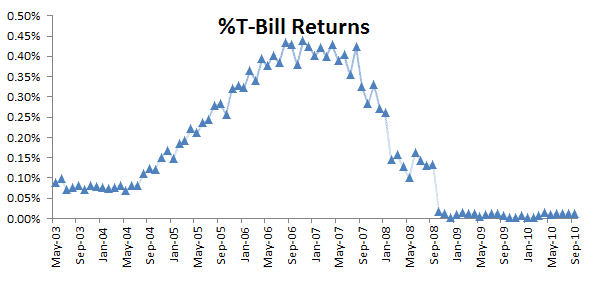
Para retornos libres de riesgo usaremos un bono equivalente de interés de la letra del tesoro (o T-Bill) de 4 semanas.
as letras de tesoro (T-Bills) se emiten semanalmente, así que interpolamos valores para alienar la fecha con el comienzo del período de tenencia para calcular el interés equivalente al bono ($r_{BEY}$) e la letra del tesoro, para un período de 4 semanas usando la tasa de descuento($r_d$):
\[ r_{\textrm{BEY}}=\frac{r_d\times 365}{360-r_d\times 28} \]
Además, para calcular el equivalente al retorno libre de riesgo para un periodo de tenencia dado ($r_{t\to t+d}^{f})$)
\[ r_{t\to t+d}^{f}=r_{\textrm{BEY}}\times \frac{d}{365}=\frac{r_d\times d}{360-r_d\times 28} \]
Where
- $d$ es el número de días en un período de tenencia dado.
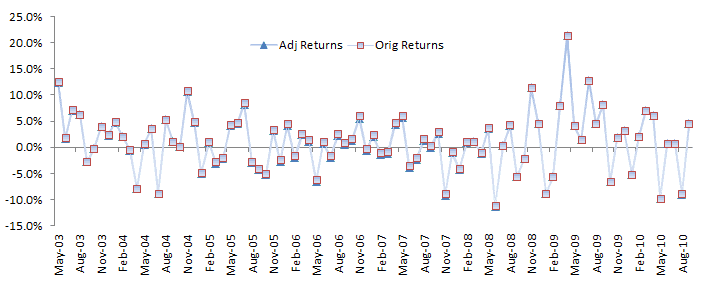
Ahora, grafiquemos el exceso o los retornos ajustados con los retornos originales. La diferencia es relativamente pequeña, y podemos distinguirl visualmente los dos retornos de forma separada.
Let’s examine the general statistical properties of the adjusted returns.
The descriptive statistics are very similar to the original data, with one exception: the population-mean is not significantly different from zero – no alpha. Interesting!
We could stop the analysis here, and refute the presence of a significant alpha – which symbolizes the portfolio manager’s skill or talent, but let’s continue and dig deeper.
The histogram and QQ-Plot look very similar to those of the original returns, with signs of a fat tail on the right side of the distribution. There is no sign of an ARCH effect, so what is causing this fat tail?
Next, we will construct a band or contour using the inter-quartile range in an effort to identify potential outliers. Once detected, we’ll try to explain them first, and then assess their impact on our findings.
The Inter-Quartile band is described as follows:
\[ \textrm{UL}_t=\textrm{Q3}_{t_o \to t}+1.5\times \textrm{IQR}_{t_o \to t} \]
\[ \textrm{LL}_t=\textrm{Q1}_{t_o \to t}-1.5\times \textrm{IQR}_{t_o \to t} \]
In essence, we are computing the quartiles and inter-quartile range using the observation values realized to that moment.
In the graph above, a few observations can pierce through the band, but only one observation stands out: In April 2009, the strategy generated 21.3% returns. This is good, right?
Whether the value is good or not is not the point here; we only care about the consistency with other observations in the sample data. Let’s assess the value’s impact on our analysis: replace the returns value for April 2009 with a plug value – say 8% (prior month return value) – and re-run the summary statistics.
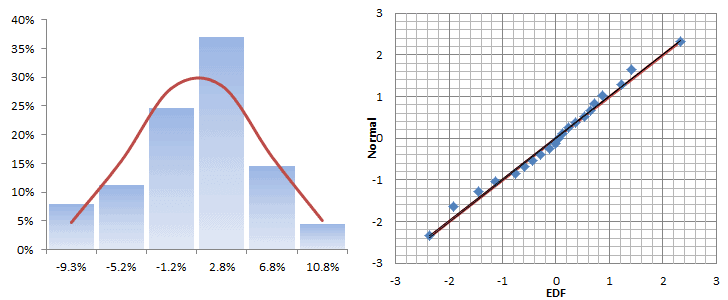
The descriptive statistics table shows a Gaussian white noise distribution. The adjusted returns mean is not statistically different from zero and its volatility is ~ 17.7% per Annum. This is very similar to the S&P 500.
Conclusion
In our analysis, the original strategy returns exhibited a statistically significant mean. Some analysts may confuse this parameter with the strategy’s alpha, but they are not the same. The alpha can only be computed with excess-returns (returns beyond the risk-free investment, such as T-Bill).
Analyzing the excess-returns of the strategy, the mean is no longer significantly different from zero, but the returns distribution exhibits a fat tail on the right side. Digging deeper, we found that this is due primarily to one outlier value.
In sum, based on the provided data, the employed strategy does not yield a statistically significant alpha.
What about the returns on April 2009; should we dismiss those? It depends, but we ought to ask a different question: how likely is the returns we saw in April 2009 to re-occur in the future? If it is a one-time incident, I’d suggest dropping it from the sample data and applying a plug-value in its place.


