WTI Futures Curve Analysis with PCA (Part 1)
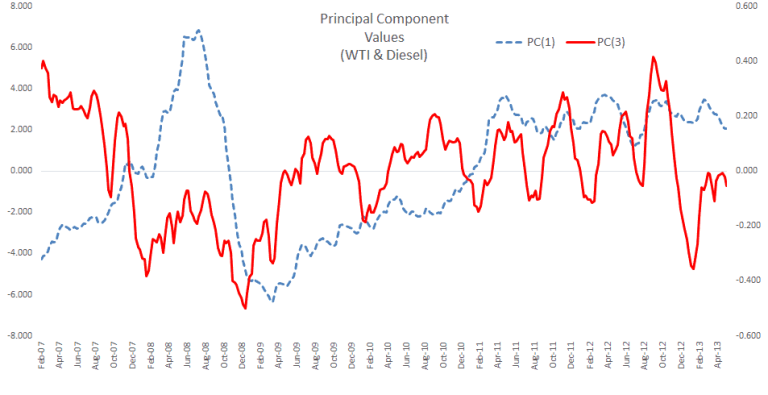
In this study, we examine the daily prices of the first four (4) contracts of WTI CL futures listed on NYMEX, compute the number of days to the delivery month for each contract, and carry out principal component analysis (PCA) in an attempt to uncover the core drivers behind the futures curve changes (i.e. level and general shape).


