Removing Missing Values (RMNA)
In practice, we come across datasets with missing values for which one or more observation dates yield invalid or missing values. Missing values situations might arise due to data collection problems, as a byproduct of processing data sets, or by design. The latter may occur in cases where we set up our models with empty cells appended to the end of the dataset, in anticipation of future values.
Missing values are designated as a “Not a Number” or “NaN” for short. In Excel, NaN is identified as an empty cell or by the special “#N/A” representation. There are a few built-in functions that can be used to detect #N/A, for example, NA (), ISNA (.), and IFERROR(.).
Dataset Dimension
An observation in a dataset can be defined by either a pair of values of two variables (x, y) or by a multi-value of three or more variables (e.g., (x, y, z, w)). A data point in a univariate time series can be expressed as (t, x_t).
In this article, we’ll consider handling data-points with missing values by removing them. We’ll consider the removal process for one-dimensional and two-dimensional (multi-variates) datasets.
For a two-dimensional dataset, each row represents a data point, and each column represents an input variable. If one or more cells in a row has an empty or #N/A value, the data-point (i.e., row) is considered a data point with a missing value and is thus excluded.
But wait a minute! What about time-series? Dropping leading or trailing data-points with missing values pose a little problem. We can simply advance the start time and finish time, but we cannot drop intermediate data-points, as it affects the time-spacing between observations.
Why should I care ?
Handling a dataset with missing values in Excel presents a challenge. While Excel has a few built-in functions (e.g., MIN(), MAX(.) COUNT(.)) that accept these datasets and silently ignore observations with missing values, the majority of functions (e.g., STDEV(.), CORREL(.)) don’t support them and will return errors (i.e., #VALUE) if these datasets are passed as inputs.
RMNA(.) Function
In many NumXL Wizards, there is a separate tab for handling data points with missing values. In this tab, the user is presented with different policies: don’t accept, remove obs., substitute, interpolate, data fitting, etc. If the user selects the “remove obs.” missing values handling policy, the input datasets are first pre-processed by the RMNA(.) in the generated formulas.
What is RMNA(.)? RMNA is a simple, yet powerful utility function in NumXL, with the sole task of detecting and removing observations with one or more missing values.
The RMNA function accepts two arguments: X and (optionally) Y. X and Y consist of one or more columns, but if Y is given, then the number of rows in X must be equal to Y.
In RMNA(.) notation, the data point is (X, Y), but the RMNA(X, Y) returns the processed X. If we wish to return the processed Y, then we reverse the order of the X and Y pair (i.e., (Y, X)).
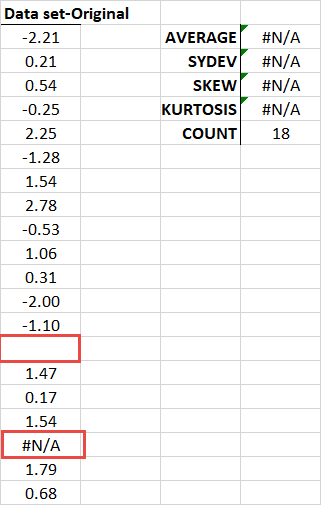
Example 1: Let’s consider the following scenario: a one-column dataset has two datapoints with missing values. Missing values are represented as #N/A and a blank/empty cell.
Using the Excel built-in functions: AVERAGE(.), STDEV(.), SKEW(.), and KURT(.) returns error #N/A, but the COUNT(.) silently drops data points with missing values and returns a count of the remaining data points (i.e., 18).
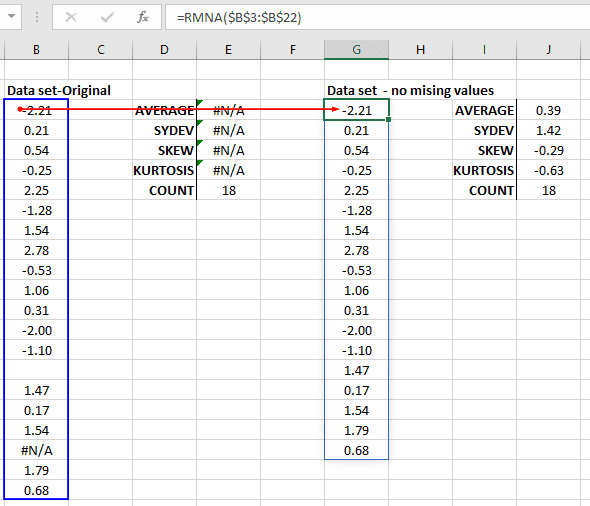
Now, let’s pre-process the dataset with RMNA(.), store it in a separate column, and pass the new column to the same functions:
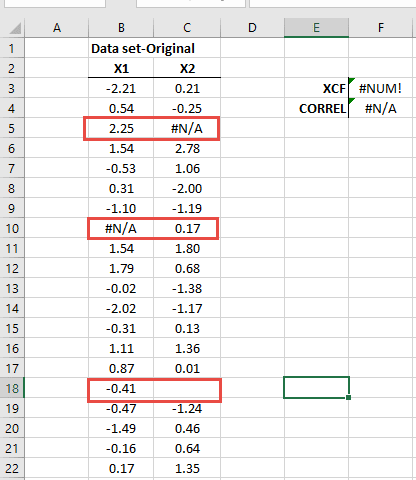
Example 2: Let’s consider a dataset of two variables (X, Y) for which we wish to calculate the cross-correlation (XCF or Excel’s built-in CORREL).
The dataset has 3 data points with missing values, so we’d need to exclude those observations before we can calculate the correlation value.
We can use the RMNA(.) in two different ways:
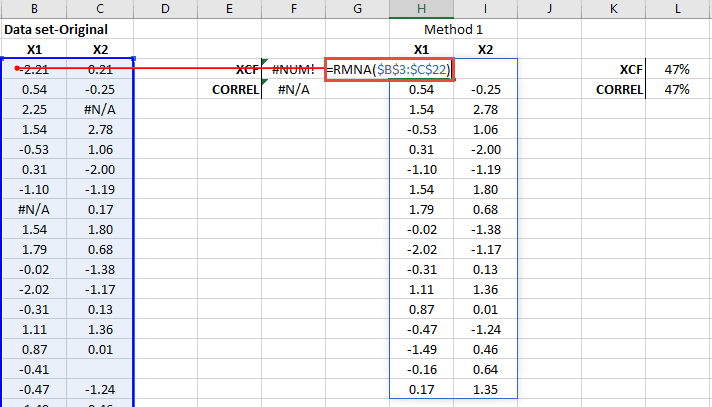
Method 1: Pass the whole dataset (columns B and C) as one argument.
The RMNA(.) function returns the original dataset after dropping any row which has one or more missing values.
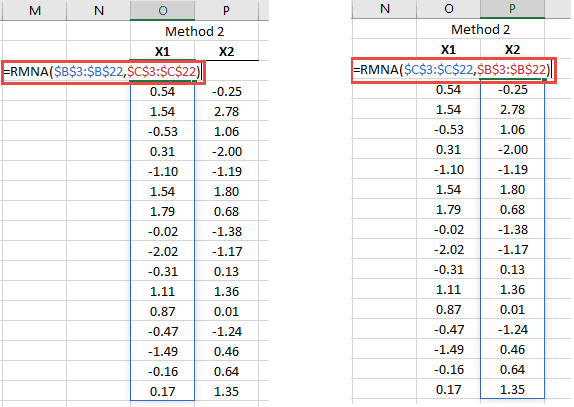
Method 2: Pre-process each column separately but use the other column as the optional reference.
By using the other column as the optional reference argument (i.e., Y), the RMNA(.) examines its datapoints for missing values also, but the function returns only the dataset specified in the first argument (i.e., X).
Note that by reversing X and Y in the RMNA(.), we can get the X2 dataset after dropping missing values found in X2 or in the X1 matrix.
A notable advantage of using Method 2 over Method 1 is that the function does not require the X1 and X2 columns to be adjacent.
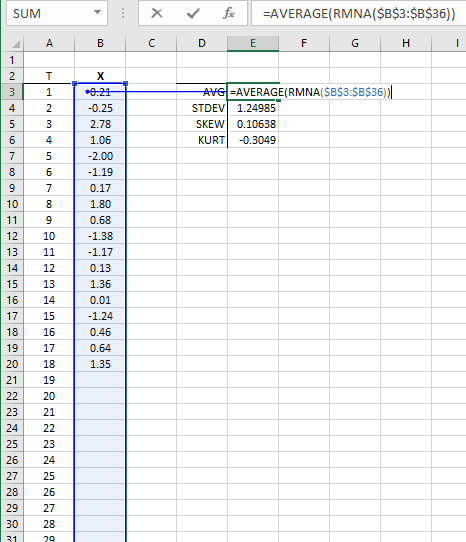
Example 3: Let’s set up a spreadsheet model for automatic updates, as new data becomes available.
Note that by adding a value in B21, the RMNA(.) will include this new value, forcing the AVG, and the other function to update their calculations.
Summary
In sum, the RMNA(.) function offers a simple, yet powerful mechanism to prepare your input data by ridding it of any data point with a missing value. The function accepts a second (option) argument which is used to determine whether a data point has a missing value but is excluded from the return results set.
To learn more technical details about NumXL’s RMNA function, please see this reference manual page. You can download a fully functional 14-day trial of NumXL and try the RMNA function yourself.


