Johansen Cointegration Test with NumXL
In general, a regression model for non-stationary time series variables gives spurious (nonsense) results. The only exception is if the linear combination of the (dependent and explanatory) variables eliminates the stochastic trend and produces stationary residuals.
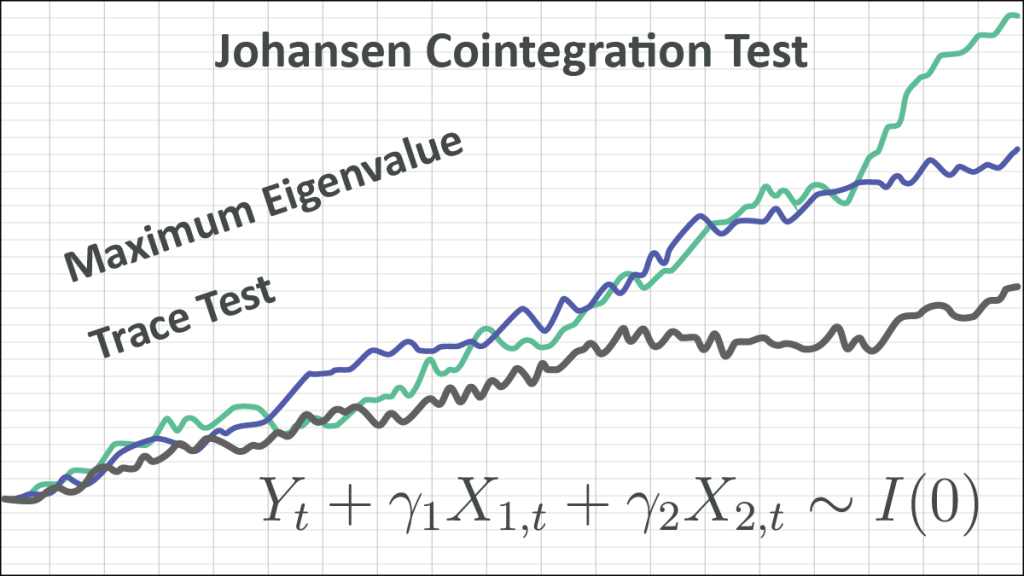
$$Y_t+\gamma_1X_{1,t}+\gamma_2X_{2,t}+\cdots+\gamma_kX_{k,t}\sim I(0)$$
In this case, we refer to the set of variables as cointegrated. It is only in this case that we can look at regression as a reasonable and reliable model.
How do we examine a set of non-stationary variables for Cointegration? We use the Johansen Test for cointegration.
The Johansen test combines two test forms to examine the cointegration assumption:
- Trace Test for $K_o=0$.
- Maximum Eigenvalue Test for $K_o=m-1$.
To establish the existence of cointegration in a set of time series variables, we wish to reject the trace test null hypothesis ($K_o=0$) and not reject the null hypothesis of the maximum eigenvalue test ($K_o=m-1$).
Process
Now, let’s go over the steps for conducting a cointegration test in NumXL.
Step 1:
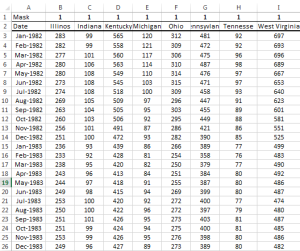
Organized your input time series data as adjacent columns. Each column represents one variable, and each row corresponds to an observation.
Step 2:
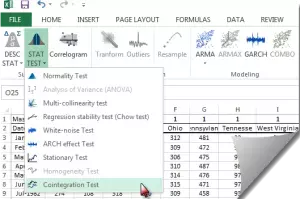
Locate the Cointegration Test icon in the NumXL menu or toolbar and click on it.
Step 3:
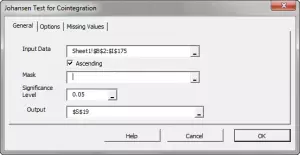
Using the cointegration wizard, select your input variables. The selection may include column labels.
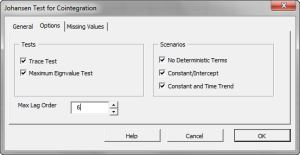
After we select the input data, the “Options” and “Missing Values” tabs are enabled.
Step 4: (Optional)
Initially, all Johansen tests are selected and a maximum lag order is calculated from the input data, but you can override any of those options as you see fit.
Let’s leave it unchanged.
Step 5: (Optional)
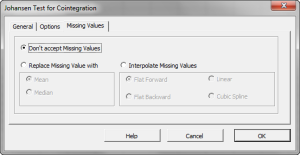
If your input data does not have any missing values, you may skip this step.
By default, the cointegration wizard will trigger an error if any of the variables has a missing value. This is acceptable for this tutorial.
Click the “OK” button.
Output
When examining the output tables, keep this in mind:
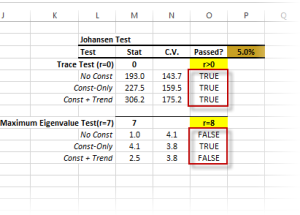
- Under the trace test, we asked whether there’s at least one possible linear combination for the input variables to yield a stationary process. We examined this question under the different assumptions for the input variable, and they all passed. Thus, we can conclude that the variables are cointegrated.
- Next, under the maximum eigenvalue test, we want to be sure that the number of linear combinations does not equal the number of input variables. Why? Because if they do, the input variables are stationary to start with, and cointegration is not relevant. Again, we carry on the test under different assumptions for the input variables. In this example, they all failed the test aside from one scenario, which passed marginally.
In conclusion, we would state that the input variables are cointegrated.
Now what? You may use OLS regression for one variable using the other variables without the risk of getting into a spurious regression problem.
To learn more about Cointegration, please visit our Reference Manual pages on the topic. You can download a fully functional free 14-day trial of NumXL to test any of our functions for yourself.
Please look into the Using NumXL or Statistical Testing sections for more articles that might interest you.
Files Examples
Please click the button below to download the Johansen Cointegration Test example.

